Something catchy here
A smart man told me recently that I would be wise to become familiar with JavaScript, so the purpose of this page is to help me explore the basics as I build my knowledge and competency. The same good gentleman also indicated that XML should probably be on my radar, so I'm glad we have a three-day weekend coming up...
A practical application
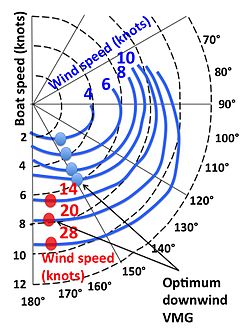
For a while I owned a sailboat, and every sailor wants to know how fast their boat can go. A sailboat's best speed is primarily determined by the strength and relative direction of the wind. This information is provided to newer boat owners via a designer's performance chart known as a polar diagram. The diagram would provide a potential hull speed over a range of wind speeds and relative wind angles.
Like many boats of its era, my 1977 Tartan 37, Island Pearl, did not come with such a chart. However, over the years various Tartan owners had gathered performance data on their own boats and shared with other owners on the forums. Some had submitted it to the ORC for inclusion in their sailboat performance database.
In 2020 I created my own polar charts to share with fellow sailors. I imported variously-sourced Tartan 37 data into an MS Excel spreadsheet, along with that of it's European stablemate the Condor 37, and produced polar charts which I then uploaded to the Tartan 37 Owner's forum.


iframe test; embedding an html page in an iframe window
A copy of my original spreadsheet can be found here.
The challenge
To reproduce the polar charts I produced in Excel on the web page using JavaScript tools and XML data imports. As I have a sum total of three weeks' reading so far on HTML, CSS and JavaScript this will be a 'proof of concept' demonstration rather than 'best practices'.
Limitations
Polar plot points are coordinates which use a radius (r) and an angle relative to an axis (θ). For sailboat performance charts, θ is the wind angle relative to the direction the boat is moving, and r is the maximum achieved speed at that angle. One of the limitations I may already face is that the polar chart is not (or was not) native to Excel, and is a modified 'donut' chart, with polar coordinates (r, θ) converted to Cartesian (x, y) coordinates as an overlay.Course of action #1
Both Plotly and Chart.js offer polar chart solutions, but so far neither seems to offer a true polar coordinate chart; rather, conversion to Cartesian coordinates seems to be required.
Course of action #2
Project a Cartesian scatter or line chart onto a polar/radar background image. This is actually the technique used to produce the charts in MS Excel. This may be the simplest and most practical solution. HTML allows for precise positioning and plotting of images on a page; scaling for different devices will be in order.The result
Hopefully something inspiring/successful here
